Graphical Analysis of Data
- DG
- Apr 5, 2019
- 1 min read

Updated: Jul 14, 2020
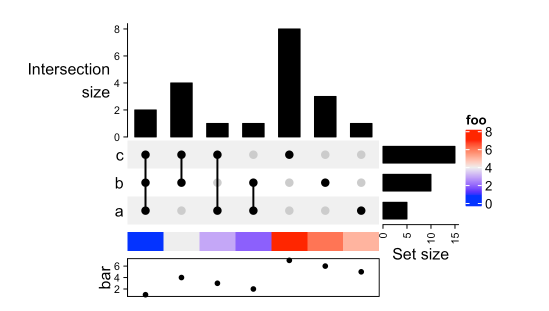
The tool allows a graphical analysis of the data producing different types of high-level graphs
Box-Plots
Density Plots
Line Plots
Bar Plots
Kaplan Meier Plots
Histogram Plots
Scatter Plots
Quantile Regressions
Click and Create your Personalized Plot


Run the Shiny App!!!


Comments